

Data reporting · Power BI
One report.
One source of truth.
We connect data from your ERP, CRM and Excel into automated business reports. Management sees margin and costs in black and white – without stitching spreadsheets by hand.
Does this situation sound familiar?
You have data, but you get no use from it.
Data scattered everywhere.
ERP, CRM and Excel apart. No consistent view.
Decisions on gut feeling.
No current reports, so you act on hunches.
Manual work every week.
Someone assembles reports in Excel instead of growing the company.
You don't know where you're losing money.
Margin drops, but you don't know why.
The ERP gives only basic summaries.
Not the ones you really need.
Every department has different numbers.
So what should management look at?
See the result
The reports we build.
Instead of a description, see real implementations. These are screenshots of reports we built for trading, e-commerce and manufacturing companies.
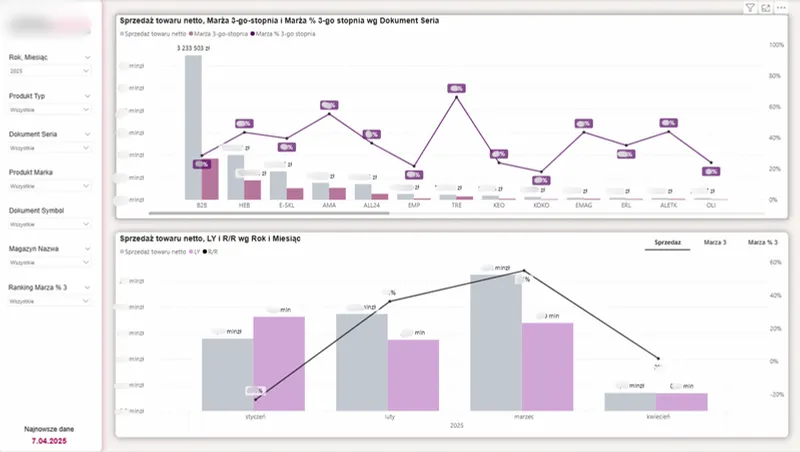
First, second and third-level margin
A full picture of profitability from Comarch Optima, beyond the limits of ERP reports.
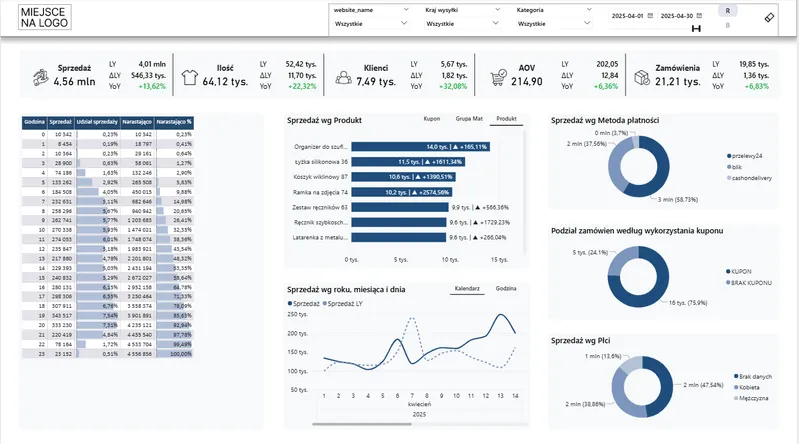
E-commerce sales and marketing
Sales KPIs, funnel and customer segmentation, sales linked to campaign cost.
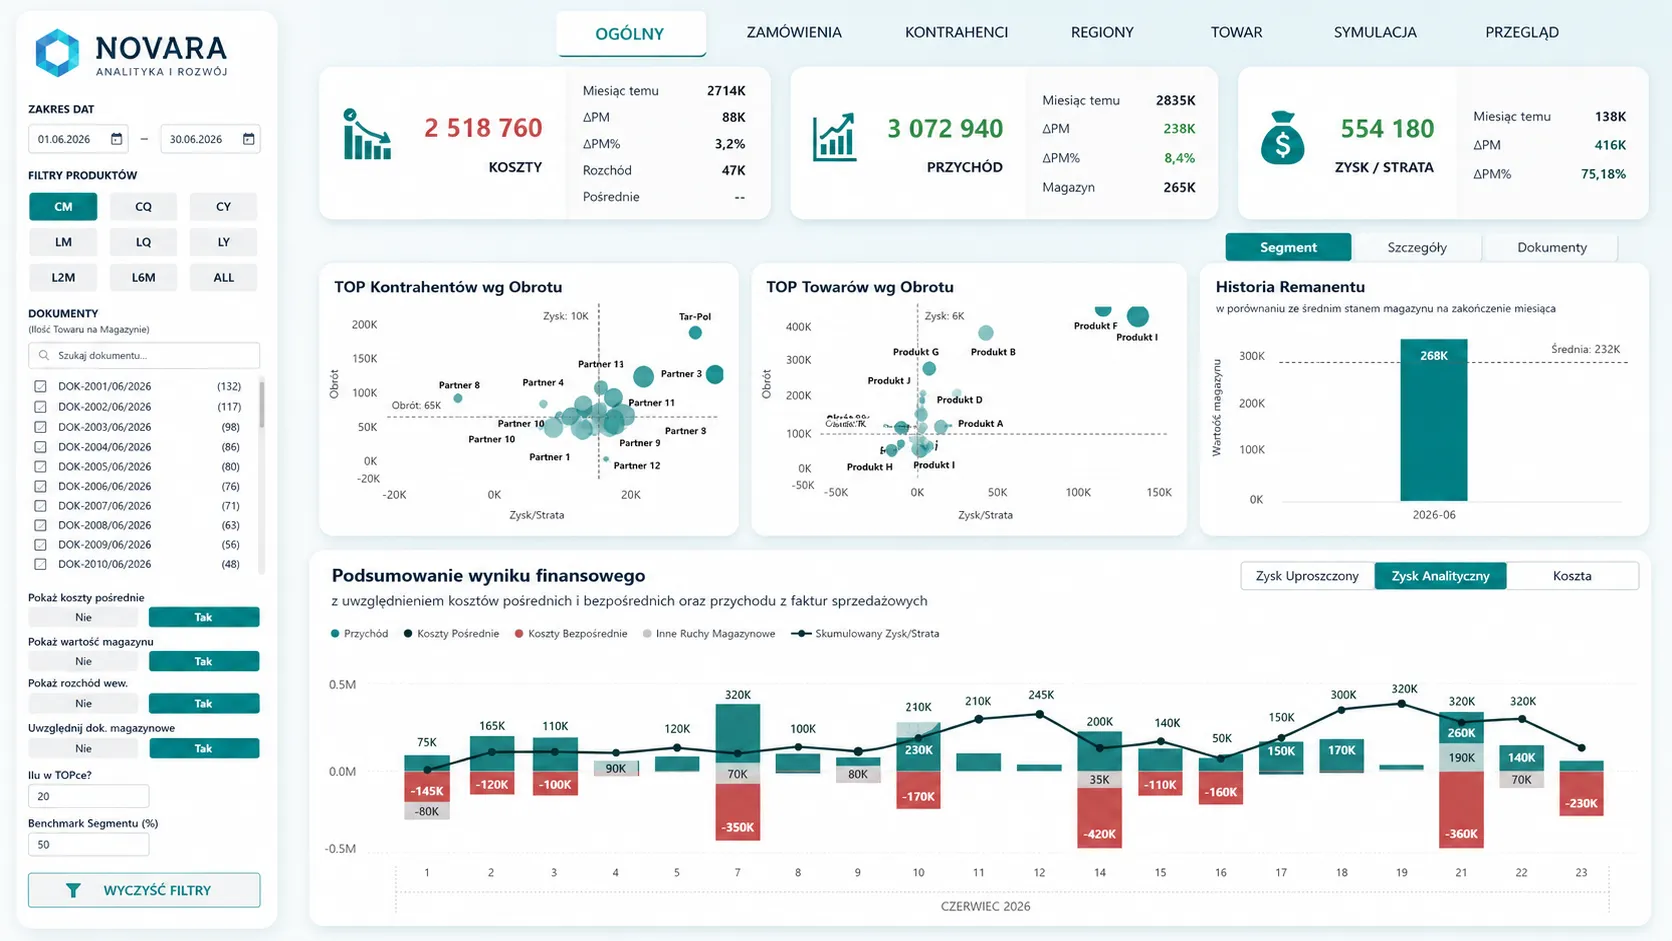
Financial results for management
Costs, revenue and profit with trends, top counterparties and a results waterfall in one view.
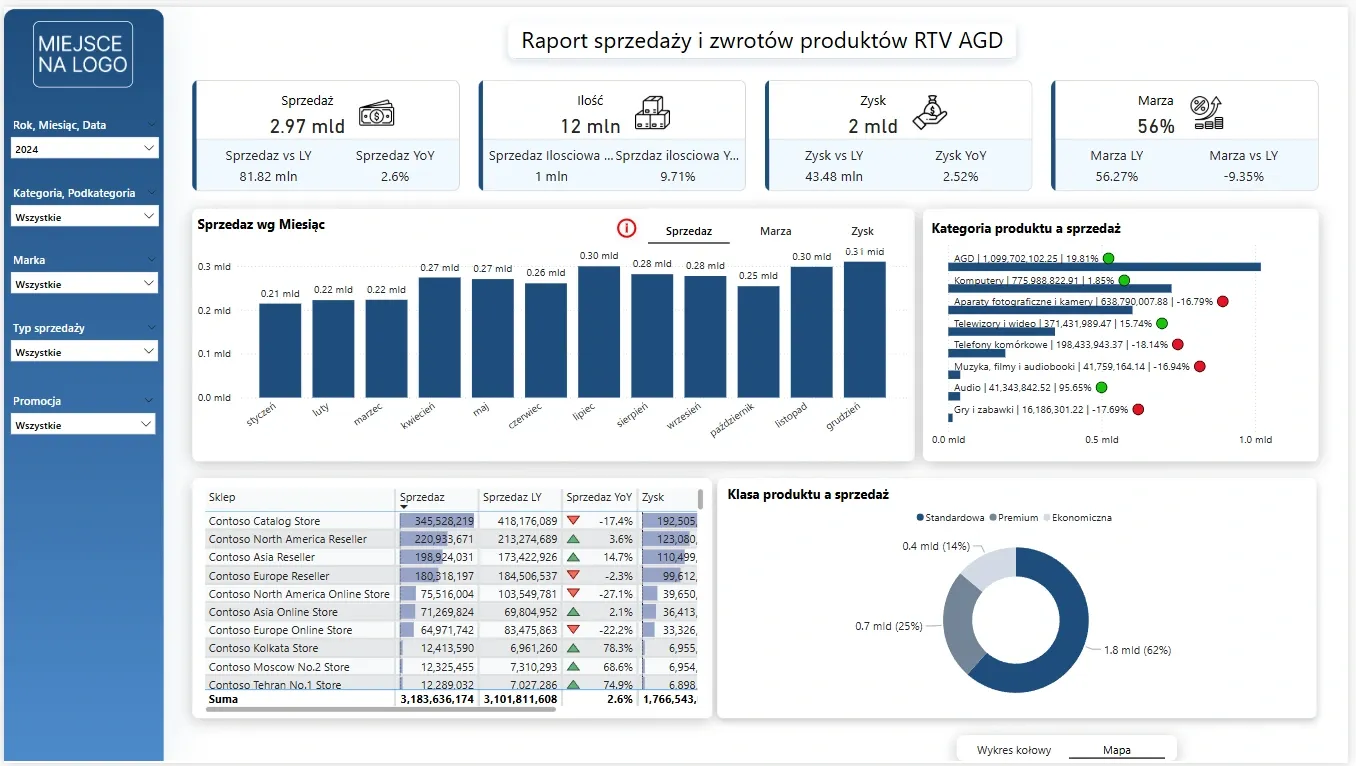
Retail chain sales
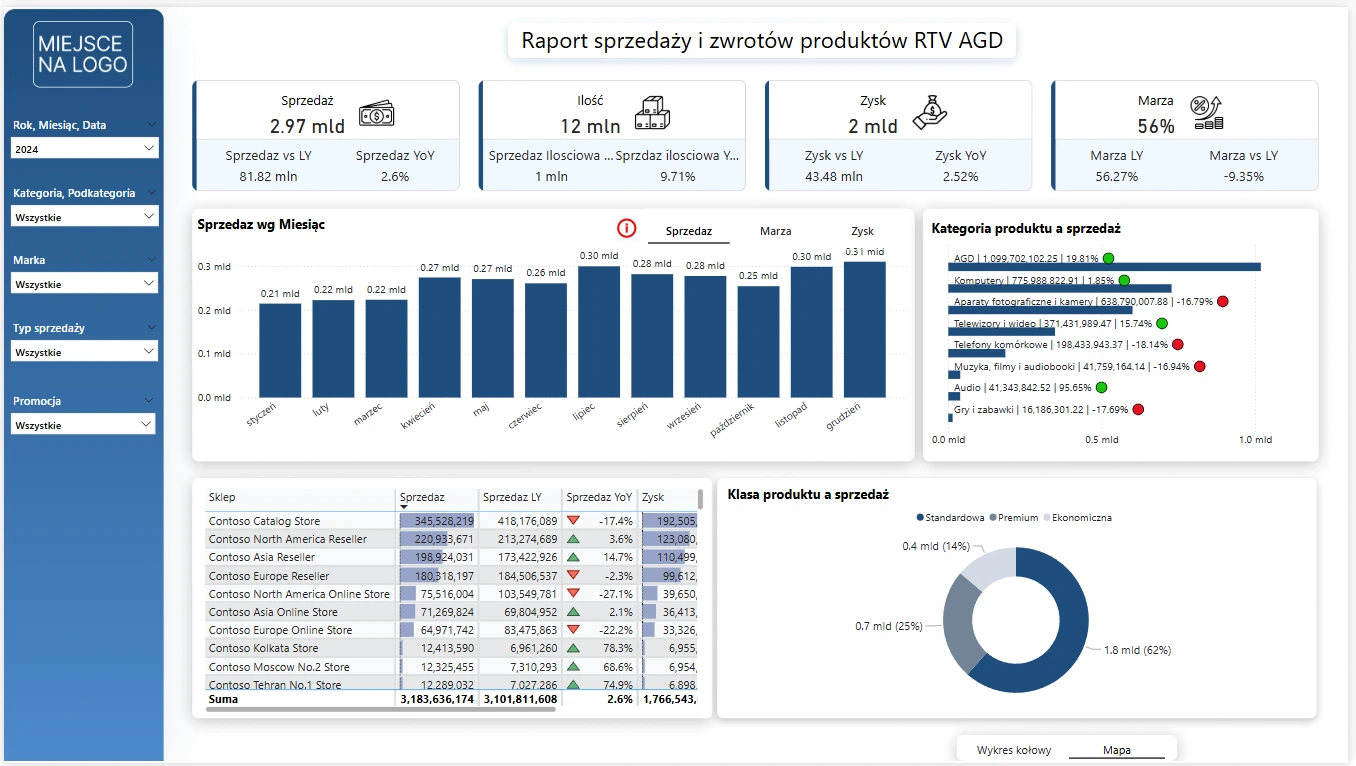
Sales, margin and profit by category and store, with ranking and year-over-year trends.
Want to see full implementations, from the before to the results? See our case studies.
We changed company names and data in the screenshots to protect client confidentiality (NOVARA is a demonstration name).
What you get
A report that updates itself.
Sales and margin
Sales broken down by salesperson, client and product. You see where the margin is and where you sell cheaper than you should.
Marketing and campaigns
ROAS, sales funnel, CRM connected with Google Ads and Meta. You know what drives revenue and what only generates cost.
Finance and controlling
Cost flow, budget vs actual, profitability at the project or delivery level.
HR and operations
Team performance, task completion, process times. For managers, not just the board.
Migration
Already have a BI module in your ERP? We'll replace it.
The reporting module in Comarch Optima, Subiekt GT or SAP usually gives only basic summaries, and it tends to be expensive and rigid. We move reporting to Power BI: cheaper, flexible and set up so that you decide what you see. We start from what you have, with no painful migration.
- We lift the reporting limits of your ERP, without replacing the system
- First, second and third-level margin and views your ERP module can't calculate
- Reports in the Microsoft environment you already have, not yet another platform
Excel vs Power BI
Drag the slider and
see the transformation.
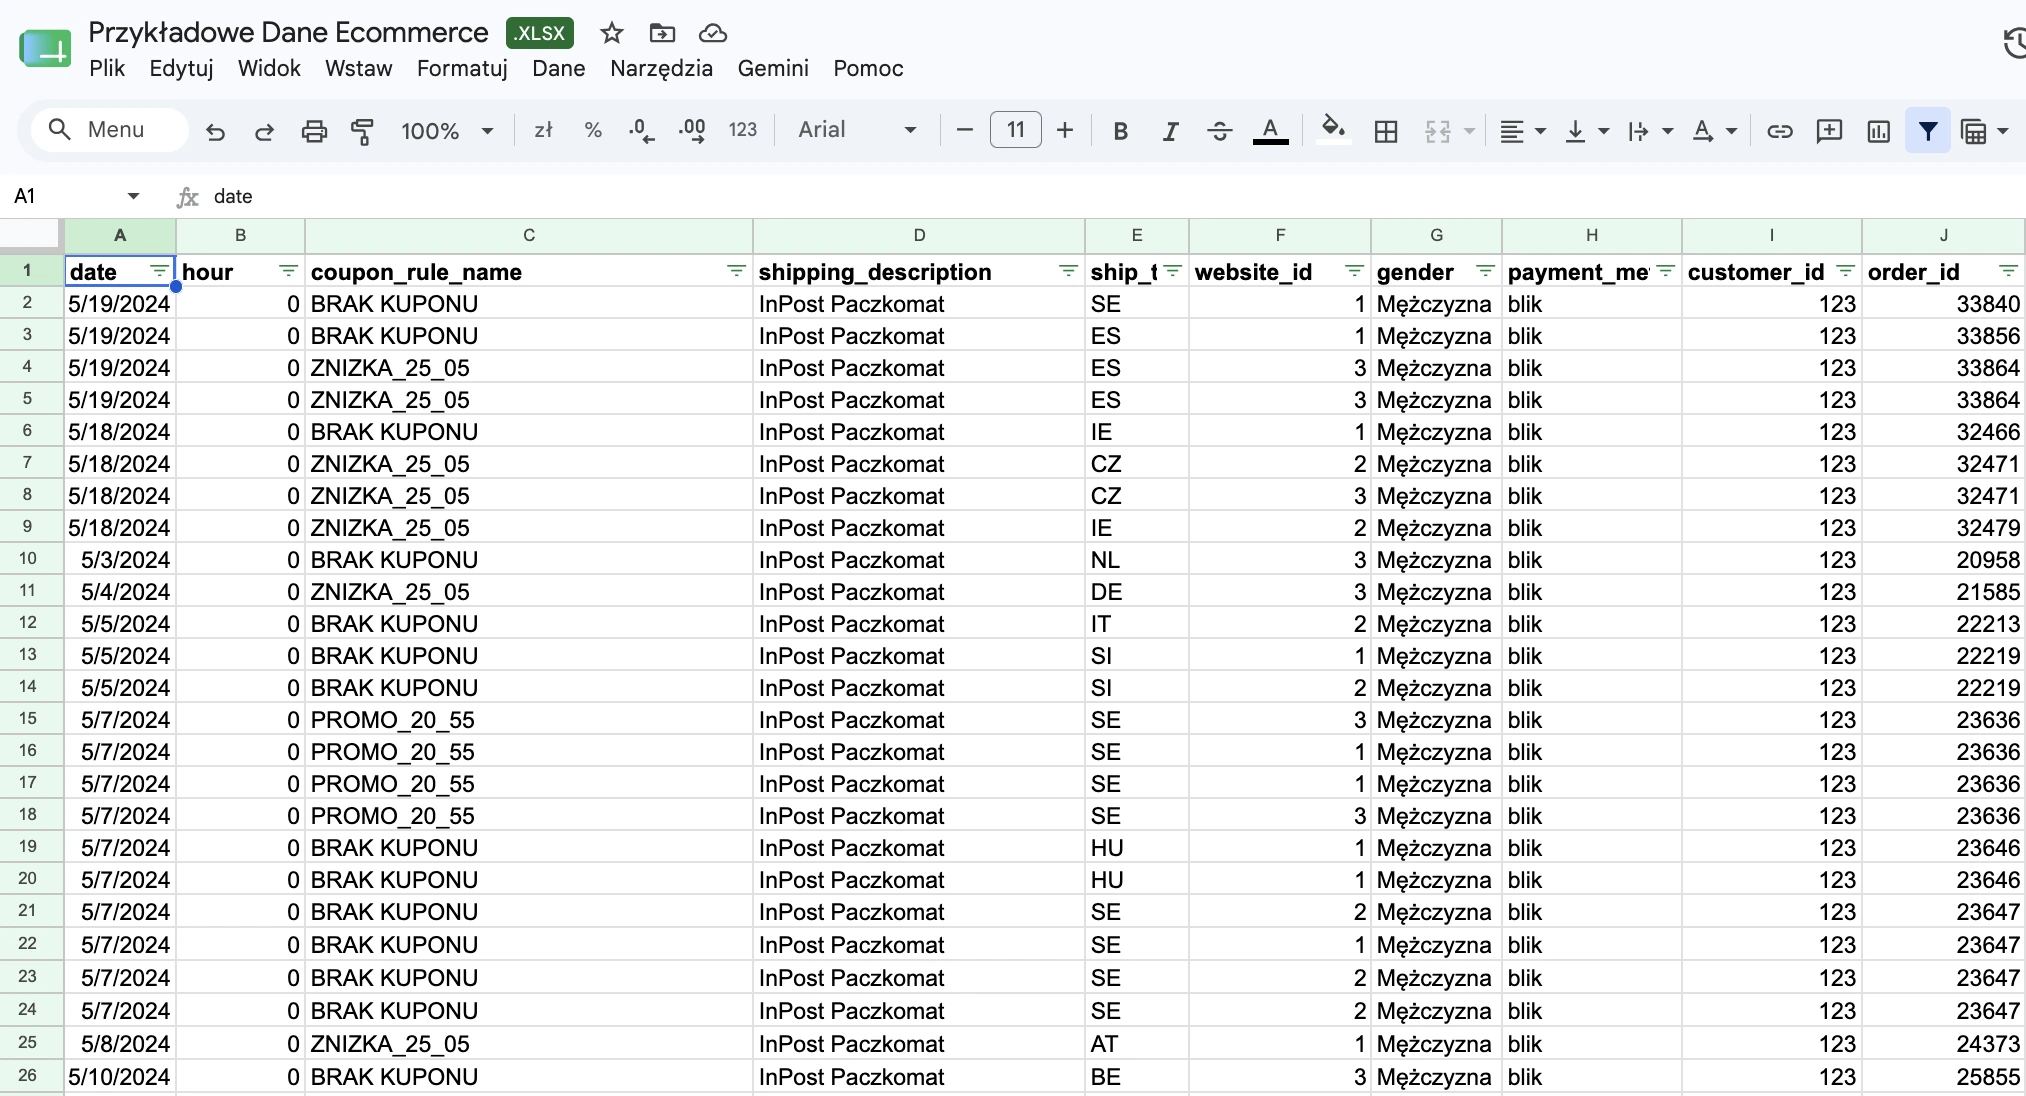
On the left: raw data from a spreadsheet. On the right: a finished Power BI report – the same file, a different value.
Methodology
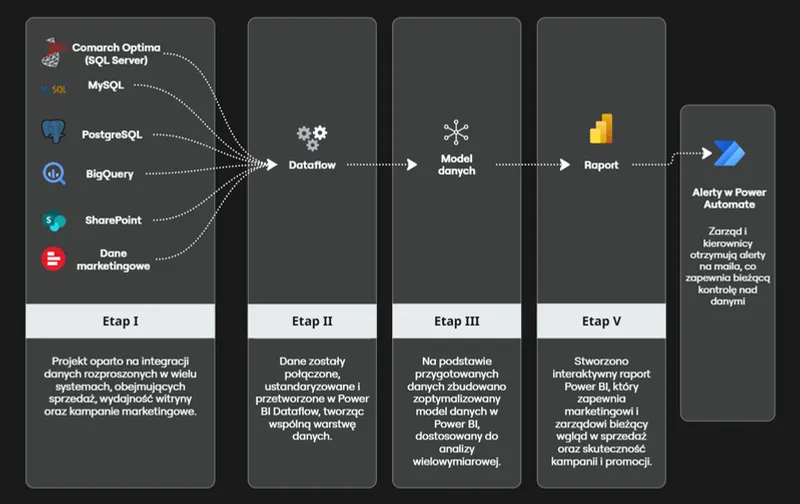
5 steps from chaos to a single view.
Data sources
Inventory of systems: ERP, SQL databases, Excel, APIs, marketing platforms.
Integration
Connecting and standardizing data. No more manual downloading and stitching.
Data model
Building a Power BI semantic model ready for analysis.
Calculations and visualization
Metrics, indicators and views tailored to the viewer's role.
Report and distribution
An interactive report and automated email alerts via Power Automate.
Basic system: about a month. Full delivery: about 7 weeks. We start with an audit for PLN 2,000, implementation from PLN 6,000 net, priced after the audit.
Security and maintenance
Secure, with no dependence on a single person.
Your data in the Microsoft cloud
Reports run in your Microsoft environment, not ours. We set access so everyone sees only what they should, for example a regional manager sees only their own region.
You don't depend on a single person
You get documentation and training, and a team stands behind the project, not a single freelancer. The solution keeps working even when someone is away.
Why Power BI
It's inexpensive, it naturally replaces Excel and you can maintain it yourself. You don't depend on an external platform, everything stays in your hands.
After handover you'll maintain the report yourself. If you prefer, we develop it further under an ongoing care plan, your choice, not a requirement.
For your IT department
We connect with ERPs (Comarch Optima, Subiekt GT, enova365, SAP), SQL databases (MSSQL, MySQL, PostgreSQL, BigQuery) as well as APIs and SharePoint. We restrict data access with RLS (row-level security). Reports run on your Microsoft licenses, and you own the data model and documentation. We discuss technical details and license selection during the consultation.
Get started
Find out whether your data can be put in order.
Book a free consultation. In 45 minutes we'll figure out what's blocking your reporting and what the first sensible step is.
- We reply within 24h – we'll confirm a slot the next business day
- You leave with a concrete plan – regardless of further cooperation
- No obligations – if you're not a fit, we'll tell you straight
“Before, I'd spend a few hours working out whether an order was profitable. Now I check it every day in a few minutes and I know what price to sell at so I don't lose margin.”
Book a free consultation
Prefer to pick a time right away? Book a call in the online calendar.
Pick a time that suits youLeave your contact and we'll get back to confirm a slot. No obligations.